From Black Box to Glass Box
Ever feel like your system is a mystery novel? Logs whisper what happened, but metrics scream how it is feeling. I flipped the script on my distributed ingestion engine, LogSentinel, turning chaos into clarity with a purposeful observability setup.
The Power Trio
- Producer - Python async workers pumping data at scale, handling burst ingestion without dropping records
- Queue - Redis lists managing backpressure, acting as the shock absorber between producers and consumers
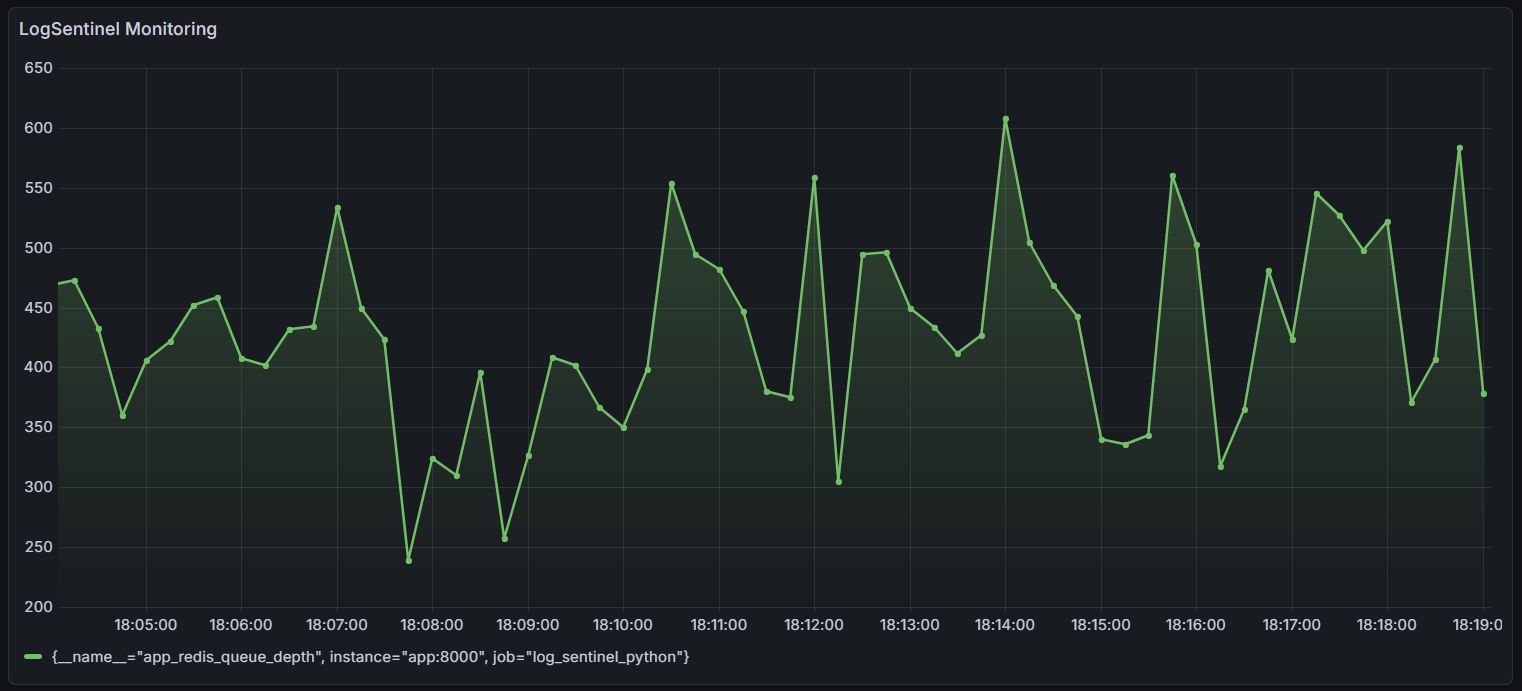
- Metrics and Visuals - Prometheus scraping custom endpoints, Grafana dashboards plotting queue depth and throughput in real-time
The Game-Changer: Custom SLIs on Queue Depth
Standard CPU/memory metrics tell you the system is running. Queue depth tells you the system is working.
I built a custom Service Level Indicator directly on Redis queue depth. The zig-zag pattern in the dashboard reveals producer-consumer dynamics instantly - you can see exactly when a producer spikes, when consumers catch up, and where the steady state settles.
No more blind spots. Just direct insight keeping the system at 99.9% availability.
Key Takeaway
Observability is not just about having dashboards - it is about measuring the right things. Queue depth is a leading indicator of system health, not a lagging one. If it climbs and does not come down, something upstream is broken before any error log fires.
Stack: Python, Redis, Prometheus, Grafana, Docker